RTI – Response to Intervention – has made its way to the top of the list of most commonly used education acronyms. Since changes to policy language in the 2004 Individuals with Disabilities Act (IDEA), the Response to Intervention framework has emerged as the favored way to identify students with learning disabilities. After a decade in our schools, it’s time to ask: how is it working? What does it look like in implementation? And how can we best serve our students through the process? The Educators Room went to the source—the educators implementing RTI— for an honest look at where theory meets practice.
This is what you had to say.
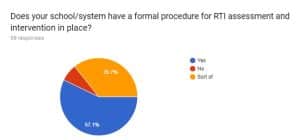
Ninety-eight educators responded to The Educators Room RTI Survey between October 15-19, 2017. Sixty-three percent of the respondents were general educators, 11% were special education teachers and the remaining 26% were a variety of professionals, including: special area instructors, administrators, academic coaches and school psychologists. Over half (51%) of the respondents serve elementary students. Thirty-two percent serve middle grades, while 15% serve high school. Four percent serve all ages. Ninety-three percent of the responses come from those who have provided RTI services.
What RTI Looks Like
Delivering Instruction
According to your responses, most (72%) Tier II small group intervention is provided by general educators. Twenty-four percent of Tier II instruction is provided by specialists. In contrast, most (60%) Tier III intensive intervention is provided by specialists, while 38% of the instruction is delivered by general educators.
Assessment Of and For Instruction
The ninety-eight responses identified twenty-four different ways that students can qualify for Tier III services. Thirty-nine percent use quarterly benchmark scores, 34% qualify students based on teacher recommendations, 29% use state assessment scores and 24% use locally-created assessment scores.
When asked how success in Tier III is evaluated in an open-ended format, responses showed wide variation. Forty-nine of the responses were specific and codeable. Of the specific responses, 35% use weekly progress monitoring scores to evaluate Tier III progress. Sixteen percent use benchmark scores and 16% use progress toward a goal. Ten percent report using grades to evaluate progress. Twelve percent of respondents report that Tier III success is not evaluated and another 12% are not sure if it is evaluated.
Opinions of RTI
The Educators Room readers had a wide range of suggestions for improving the RTI system. The three most frequent suggestions included more time, more people and more consistency. Adding support staff, specialists or reducing the student/teacher ratio was recommended most often (23% of responses). Ten percent of responses mentioned the need for more procedural consistency and 9% highlighted the need for more time. Responses also expressed the need for more resources, more communication and collaboration, more training, more support and less paperwork. Several responses recommended pull-out versus the push-in model for small group work. Multiple respondents referred to the importance of setting clear RTI goals related to timelines and identification of learning disabilities.
[bctt tweet=”I literally hate my job, but love my students.” username=”EducatorsRoom”]
Things that Work
You were eager to share methods, resources, and programs. This is the complete list of recommendations:
| Methods and Strategies | Free Resources | Recommended Products/Programs |
| Task cards | Khan Academy
https://www.khanacademy.org/ |
Barton Reading System
|
| Modelling assignments | Newsela
https://newsela.com/ |
Great Leaps
|
| Breaking down assignments and activities | Scratch
https://scratch.mit.edu/ |
Fountas and Pinnell LLI
|
| Reading aloud to reluctant readers | Intervention Central
http://www.interventioncentral.org/ |
Reading Mastery
|
| Peer buddies | Florida Center for Reading Research
http://www.fcrr.org/ |
SRA Corrective Reading
|
| Preferential seating | Fundations
|
|
| Super flexible math groups | Achieve 3000
|
|
| Color-coding | Read Naturally | |
| Visuals | Words Their Way | |
| Daily time dedicated to interventions | Orton-Gillingham | |
| Student choice | 95% Group | |
| Explicit instructions | IReady | |
| Plans for Tier 2 and 3 students that are like 504 | IStation | |
| Student self-assessment, goal-setting and progress monitoring | Read Naturally | |
| Intervention menus | Project Read | |
| Study Island | ||
| Student-teacher conferencing | WIAT-III | |
| Metacognitive strategy instruction | KTEA-III | |
| Community-building games | Brigance | |
| Mindfulness activities | ||
| Vowel cards | ||
| Fake word sorts | ||
| Hands-on activities | ||
| Engaging reading materials | ||
| games | ||
| practice | ||
Final Thoughts
The survey concluded with an open-ended question asking for final thoughts on RTI. Of the 46 responses to the optional question, 65% were negative in tone or expressed frustration with the RTI system. Twenty-four percent of the responses were positive and expressed hope in the process. Eleven percent of the responses were neutral.
Where do we go from here?
The survey responses raised many questions about how middle and high school fit into the RTI puzzle. Responses also demonstrated a need for more teacher support. With such a wide variety of experiences and opinions, it is clear that the RTI conversation is just beginning. Because over half of the survey responses expressed frustration with the system, it is also clear that the conversation must continue. As one response stated, “I literally hate my job, but love my students.” It’s clearly time for the teachers to talk and policymakers to listen.