[fusion_builder_container hundred_percent=”yes” overflow=”visible”][fusion_builder_row][fusion_builder_column type=”1_1″ background_position=”left top” background_color=”” border_size=”” border_color=”” border_style=”solid” spacing=”yes” background_image=”” background_repeat=”no-repeat” padding=”” margin_top=”0px” margin_bottom=”0px” class=”” id=”” animation_type=”” animation_speed=”0.3″ animation_direction=”left” hide_on_mobile=”no” center_content=”no” min_height=”none”]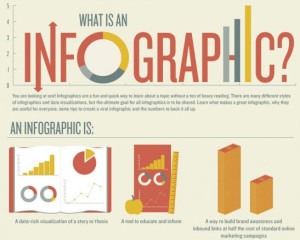
Each summer our school offers flex time for professional development. Most faculty seize this opportunity to meet, work in teams, document our hours for the day and submit our accomplishment which substitute for an In Service day during the school year. Well rested educators impart work efficiency and effective collaboration. In preparation for Summer In Service, I’m also documenting my prior work flow at home. These self appointed studies are my Selfies and they are worth sharing.
Without balance, work consumes me and my summertime needs: a need for adventure, a need for home management and a need for educational inspiration. Undivided attention to family gives me tranquility and focus while tackling home improvement put off during the school year improves my time management. Next week I begin assessing student summer projects for World History AP so this really is my last week to enjoy learning what I want when I want it. I have a three prong approach to 10 hours of Selfies. (Summer Educational Links to Fantastic Information Emphatically Synthesized).
Exploration. 20 minute before bedtime is reserved for reviewing YA literature or favoriting posts from Twitter. I use Twitter and now Tumblr primarily for professional interests (Facebook reserved for personal connections). In the morning, on my porch with coffee in hand I have the clarity to read my links. Following Slate on Twitter led me to Annie Murphy Paul’s article, “Educational Technology Isn’t Leveling the Playing Field“
My husband/ tech integrationist discussed the pros and cons of her findings. A digital gap based on how technology is used by children of different socio economic bases is exacerbating the problem; decisions to avoid funding of access to these tools because of the results is not the answer. We surmised that our own stand contrasts, children need these tools regardless of how they use them. Experience and play are part of that messy, fruitful process. Tools are not the problem for the digital gap but how we model use is the problem. With this in mind I moved on to another article, “10 Free tools for Creating Infographics,” by Sarah James and the conclusion to use 2 hours of exploratory time comparing creations within each application.
Pioneering– When teachers assign applications it is really important to know what students will be capable of producing. What is the expectation for initial experience. for 1/2 hour, for 1 hour and for edits changes? More and more apps are offering not just a final product but an editing experience with teams of collaborators online from anywhere in the world (Visual.ly offers this). Beginning with Easel.ly, I immediately confronted the incompatibility problems with iPads. It would make so much sense for infographic design to work on iPads. My husband suggested using Pages for design since I already have it but to continue working with Easel.ly on my Mac. I watched the 2 minute how to video and began creation. A group discussion of suggested children’s lit by state led me to think that sharing titles visually would be useful for our nationwide comparison. My first infographic would be an abbreviated list of picks promoted by the Vermont Department of Libraries. I started with a template and began plugging in content. Within 30 minutes I created a clunky version of my vision and a list of difficulties faced with the app. I continued to move through apps suggested by Sarah James. I improved my initial book list creation with Piktochart. Its interface appealed to my style. I started an account and email correspondence with Visual.ly and suddenly reached my time limit.
Evaluation– So what? What’s the added value? These questions move through my mind as I complete a 9 mile run. The benefit of a Selfie schedule unlike a regular school day is the time I can afford for processing. Infographics communicate difficult information quickly. They helps us distinguish perspective. Right before my run I heard a news story on NPR in which a comic artist was working with the medical community to achieve a similar goal; communicate complicated research with clarity. The BBC tweeted an article comparing Hamas and Israeli use of infographics promoting empathy for their cause in this recent Intifada. (“Hamas and Israel Step up Cyber Battle for Hearts and Minds,” by Sarah Fowler- ).
Both sides have increasingly turned to graphics to demonstrate their version of events in numbers and, at times, they have actively engaged with one another in an attempt to disprove a claim.
Does this sound familiar? Let’s look at the Common Core Standards to find similar goals for reading and writing. The manipulation of icons is an ideal means in which students can “integrate knowledge” and ideas or emphasize “craft and structure”.
Integrate quantitative or technical analysis (e.g., charts, research data) with qualitative analysis in print or digital text.
Analyze how a text uses structure to emphasize key points or advance an explanation or analysis.
[/fusion_builder_column][/fusion_builder_row][/fusion_builder_container]